
The Question of Anomalies Detected Voice and Speaker Identification
by Daniele Gullà, ©Daniele Gullà – All Rights Reserved
Interdisciplinary Laboratory for Biopsychocybernetics Research, Bologna, Italy
1. Listening to the sound material: between psychoacoustic perception and electroacoustic analysis
Listening to the material recorded during the Electronic Voice Phenomena (EVP) or Instrumental TransCommunication (ITC) experiments requires that the listeners pay particular attention. To judge and correctly classify what they will hear, they should have at least an overview of the psycho-acoustical dynamics of the human auditory system, and the fundamental principles of phonetics and acoustics.
This lecture will address these subjects and provide useful cues for considering the complexities of listening to and decoding the sound material which is fundamental to conducting serious biopsychocybernetic research (Note here that “biopsychocybernetic” is used as an alternative to the more obsolete “parapsychology” and “paranormal”).
1.1 First Stage: one or more subjects listen to the sound material.
In this stage, the personal characteristics of each listener must be taken into account. The human ear and the cerebral centers responsible for sound decoding have peculiar features that are unique for each subject.
The path of the sound vibrations goes through the outer ear duct, the tympanic membrane, the hammer, the anvil, the stirrup and the oval window, up to the cochlea, which is filled with a special fluid. A thick cord of nerves connects the cochlea to the brain.
The widespread belief that the human acoustic perception range goes from about 20 to 20,000 Hertz (cycles per second) seems to be inadequate. Some recent discoveries have shown that a person is also able to hear the so-called ultrasound when the transmitter directly touches the head bones, so that the sound does not have to travel through the air. However, human perception averages these signals so that only one tone is heard.
We hear all frequencies between 20,000 and 70,000 Hertz at exactly the same higher tone that we can hear in the air. A peculiarity of the human being is to have—somewhere inside the ear—a sophisticated spectrum analyzer which is capable of breaking the sounds up on a harmonic basis in much the same way as is seen in Fourier analysis. It would therefore explain the particular sensitiveness and accuracy of human hearing faculties compared to animals which also have less complex analyzers, with a lower dynamic sound capacity. For example, consider the complexity of the compound sound, which becomes grandiose in a symphony, and how sophisticated the human ear must be to distinguish the smallest nuances of every instrument.
1.2 Second Stage: differentiation of the sounds of language.
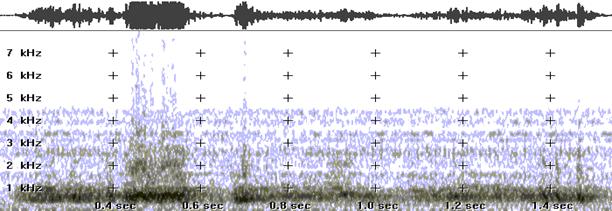
In addition to the subjective analysis made through our ear, an objective electro-acoustic analysis is useful. In fact, our ear could interpret some sounds, which occur in succession with a peculiar rhythm and intonation, as parts of a melodic chain of a language. This also occurs if the sounds do not actually come from a real human verbal source but from noises produced in a particular sequence, which can lead to a linguistic interpretation of the noise. This is referred to here as “psycholinguistics.” Please refer to Figure 3.
The problems encounter in decoding such sequences of sound essentially depends on the listener’s comprehension skills. Every person is different as far as the interpretative skills of sound are concerned. Some people are able to catch either small differences or sound nuances, or to reproduce at will sounds already heard and mentally compare familiar sounds with new sounds. When, for example, people study a foreign language, they are inevitably inclined to “hear” the sounds of that language as sounds of their mother tongue; but, after a little practice, they can begin to compare the new sounds with familiar ones, finding differences and similarities. Therefore, if they want to correctly pronounce the new language, they must exercise their ear to recognize new sounds.
The capacities of learning new sounds could explain the hearing differences between subjects who conduct EVP experiments and subjects who do not: EVP experimenters have selectively trained their ears to listen to those peculiar sounds.
Most of the sounds which surround us, including language, are made of various types of waves that are complex tones which do not always show a periodic pattern. A complex tone can be considered as the algebraic sum of more sinusoidal signals, each one with a given frequency and strength. If we know these two parameters for each sinusoid, we can determine the spectrum of the complex signal we are examining.
If the signal is periodic, from the breakdown of each sinusoid we will find frequencies which are a multiple of a frequency called the “fundamental frequency.” The fundamental frequency is usually the sinusoid having the lowest frequency and the highest sound intensity; the others are called partial or harmonic components.
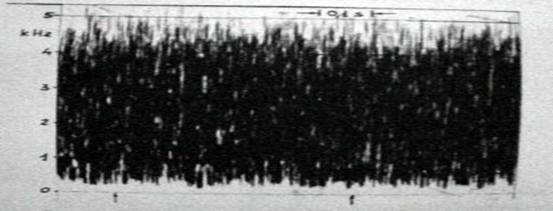
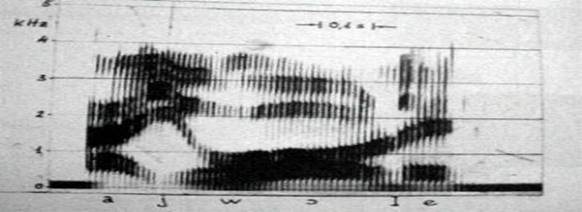
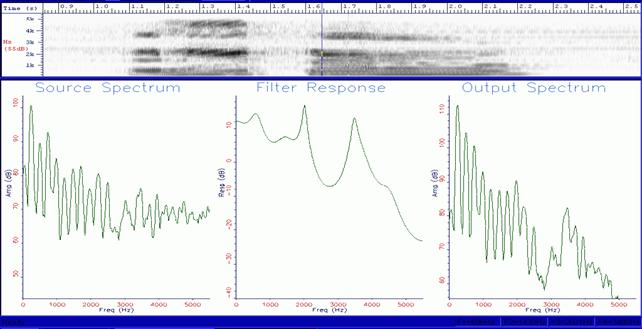
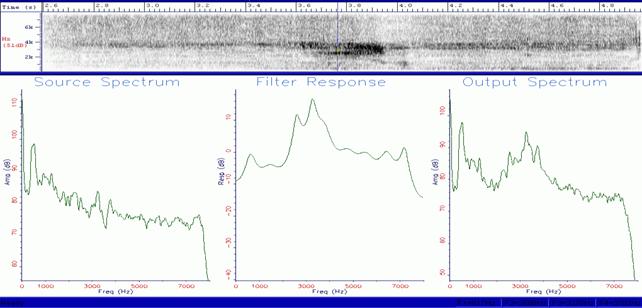
The spectrum of a periodic complex signal, such as a human voice as shown in Figure 2, is discontinuous: it is a so-called, “line or discrete spectrum.” The spectrum of a pure sound is made of only one line (frequency), whereas the spectrum of noise is usually made of a spectrum called “continuous” (Figure 1) where the lines are very thick and placed one on top of the other, so that they make a continuous thickening (or, in some bands, like a noise made by some consonants). Therefore, the first classification of the sounds in different auditory types can be based on the discrepancy between the periodic and aperiodic vibrations (harmonic and non-harmonic spectra). This discrepancy is what we usually call “sounds” and “noises.”
Among the language sounds, the sounds called “vocoids” (vocalic) are usually of periodic type (simple tones), while the sounds called “contoids” (consonantal) are noises or have some noise components. In the spoken human language, the single sounds come together in a continuous connection: not only is the vibration curve of each letter affected by the letters between which is included and among which a common aura is produced, but also by the sounds which come before or after it in a given length of time.
1.3 Third stage: comprehension of the elements which characterize a human voice.
As we have just described, the complex tone which composes the human voice (but also many musical instruments) is made of a sequence of sinusoids. The sequence which has the lowest frequency is called “fundamental frequency” and the following sequences with a higher frequency are called “harmonics” and they can be odd or even multiples of the fundamental frequency.
In the human voice, the sound intensity, the timbre and the audibility are largely due to the number of harmonics in the acoustic spectrum. The voice of a child with a high tone has very few harmonics; the average voice of a woman has more harmonics, and therefore, it is more comprehensible. The voice of a man with a deep tone is far more comprehensible because it is richer in harmonics (more thickening).
The peculiar timbre of a human voice also depends on the position of the so-called “formants.” For example, the human voice can be extensively modified by the path it makes from the larynx to the outside, since more resonances are made in certain frequencies than in others. The range of possibilities is practically endless and a specific peculiar pattern of the harmonic spectrum results from each arrangement of the vocal path.
The study of the formants is particularly effective in research concerning the relation between the resonances of the acoustic sources and the timbre. In this field, the human vocal apparatus is the most expressive, and perhaps, the most complex system. Other sound sources cannot change their resounding features. In fact, the variations of timbre in musical instruments can only be caused by affecting the dynamic of the vibrant body but not the instrument resounding features, which apart from structural alterations, cannot be modified.
On the contrary, in the human vocal characteristics, the subject can modulate the timbre not only changing, as far as possible, the dynamic of the vocal chords, but also changing the use and the width of the resonant cavities. In the usual cadence of verbal speech, the total number of movements needed for uttering words from the lungs to the vocal chords, the lower and upper resonant cavities, the tongue and the lips, is about 50/60 actions per second. That is why the qualitative modulations of the human voice are undoubtedly more varied than any other sound source.
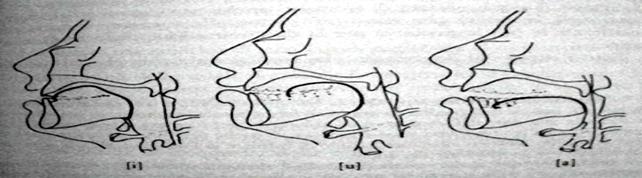
In actual fact, the vocal tract works like a filter, strengthening some group of harmonics called “formants.” In an adult, the resonances due to the oropharyngeal cavity are produced at about 500, 1500 and 2500 Hertz. They correspond to the values of the frequencies of the first three formants: these values allow us to mathematically calculate the vocal tract length that is about 17.5 cm. It goes without saying that the acoustic resonances change following the kind of sound produced and the subject producing it.
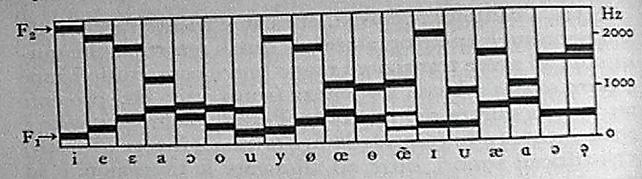
The Italian formant values are slightly different from the French or Russian ones, or those of other countries. Also, the same Italian formant values are different if they come from different regions or belong to dialects with or without a different accent. Moreover, as far as the main vowels of the Italian language are concerned, they correspond to different values which can be separately ascribed to each vocoid. The values of the first two formants—the most important—are usually sufficient to hear the differences among each vowel (i, e, a, o, u) as shown in Figure 4. The features which characterize the human voice are countless and it is important that the EVP/ITC experimenter is able to distinguish them clearly in order to compare them with the anomalous recorded sounds. It is clear that, at this stage, we should take into account the qualitative and quantitative characteristics of the analyzed evidences in order to make a correct measurement. A bad recording quality partially jeopardizes the precise reading of the plots we want to interpret. Moreover, we could lose or hide some important spectrographic, morphologic and structural characteristics which would lead to lost information.
1.4 Fourth stage: detecting anomalies
Taking into account the main properties of the human voice, we should be able to know the nominal deviation from the predictable values of the analyses. In this field of researches, the phonetician comes into play. This is the person who studies the Articulatory Phonetics and Tonetics. The phonetician can recognize the type of spoken language following the so-called Phonetic Transcription Standards which use symbols to correlate any kind of sound to a language.
This is the most complex stage, both for the phonetician who makes the measurements and for the EVP/ITC researcher. They both must devise a standard classification of the acoustic events judged anomalous, in accordance with tables and parameters of comparison, and show the predictable deviation percentages from the standard.
2. Examples of analysis made on “unusual voices.”
Figure 6 and 7 refer to the analysis made on a magnetic tape where the voice of a Gracula Religiosa, a bird known also as Hill Myna, has been recorded. In this example, we have examined the word “Renato” that the Gracula has uttered on request of its trainer. The anomalies that I am going to describe will be clearer if you will look at Figure 8 and 9, where I have tried to faithfully reproduce the same word with my own voice, trying to imitate the bird voice. At the bottom of the diagram, we can notice the strange configuration that the computer gives us about its virtual reconstruction of the acoustic vocal tract.
The example certainly cannot be the voice of a human being!
In this case, having changed my voice, the “O” sounds more like a “U” but it can be represented in the table with almost normal values for the human voice. At the bottom, the vocal tract is normally structured.
Somebody will ask why we hear the word “Renato” uttered by the bird. It is a simple, and at the same time, a complex answer. The solution partly lies in the acoustic perception physiology and in the connections made by our cerebral database, when it is stimulated by a melodic sequence with particular linguistic attributes. In practice, the computer tells us that those sounds do not exactly correspond with the word “Renato,” as it is in the usual human elocution, but with a sound melodically similar that our brain decodes as such, and makes the appropriate changes.
uttered by the Gracula Religiosa.
If you make the difference between the average values of the first two formants of the analysed acoustic evidences, you will notice that—even if they are very different (718/1129 and 380/790 Hz)—their ratio is almost the same (410 against 411). It therefore explains our auditory sensation, since the formant ratio of the “O” does not change.
Something similar happened to a dolphin which could imitate the human voices with a higher register (high frequencies). It was significant that, besides the melody and likeness to a human voice for the Gracula, the ratio of the formantic structures (resonances) were similar to the values in the human vowels.
How the bird can learn sounds from us that do not belong to its language is another field of study. It is enough to know that some birds called “polyglot” or “imitator” are able to imitate the vocalism of other species. The phenomenon is also called “vocal mimicry.”
3. Some examples of analyses of sounds of presumed bio-psycho-cybernetic origin.
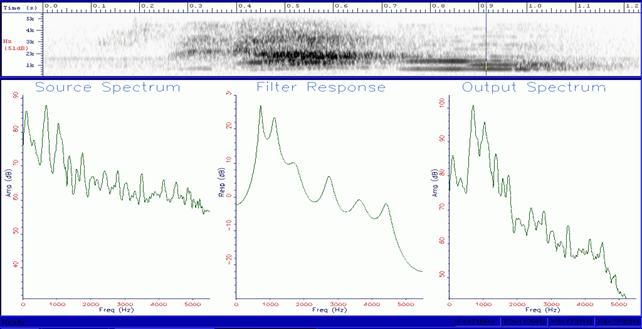
In Figure 10, we can see the spectrogram of a presumed anomalous voice recorded by microphone on magnetic tape by Michele Dinicastro (Research Manager of the Biopsychocybernetic Laboratory) in a silent environment. The voice would seem to pronounce the word “Gesù” (Jesus).
The spectrographic analyses show an approximate formantic structure almost without fundamental frequency and periodic vibrations typical of a voice of human origin. As you noticed from the spectrogram, the fundamental frequency and the laryngeal vibrations are not present. We can partly explain this datum because the voice is whispering.
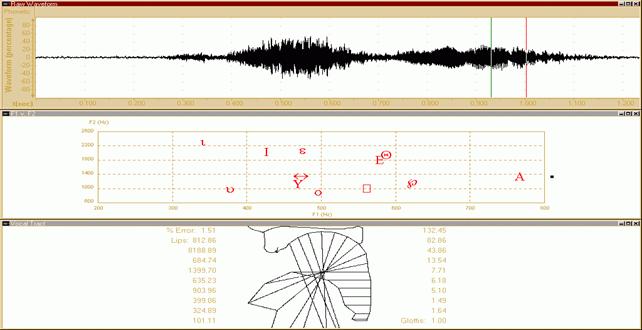
In Figure 11, we notice in the top image the oscillogram of the voice, in the centre the trend of the fundamental frequency and at the bottom the virtual reconstruction of the vocal tract. It is interesting to notice that the fundamental frequency F0 is only detected in the last part of the sound “U” (in the dampening phase), as well as the vocal tract, which shows the presence of laryngeal vibrations typical of sustained sounds, like vowels.
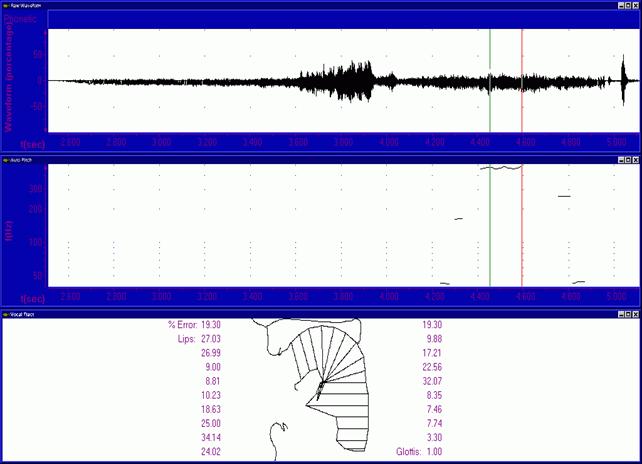
The section with more acoustic power (“Ge”), which corresponds to the central part, does not have the fundamental frequency F0 and laryngeal vibrations. Therefore, the shape of the vocal tract is not outlined.
In the “U,” which is indicated with the vertical lines, the vocal tract has normal dimensions but anomalous structure. The involved zones have excessive dimensions in order to get out this sound with a correct posture. In addition, the pharynx, the epiglottis and the larynx are moved forward and are too long.
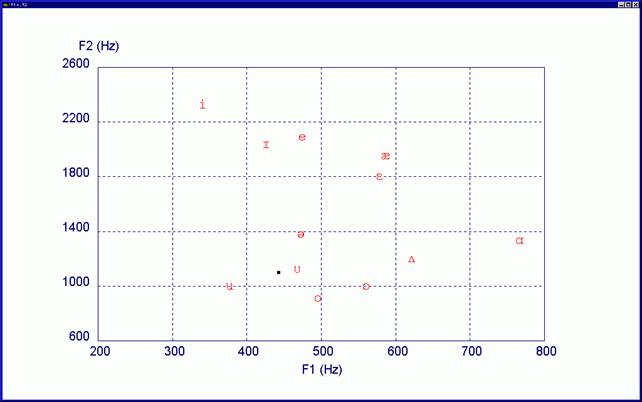
Figure 12 shows the value of the first two formants (F1 and F2) relevant to the “u” vowel in “Gesù.” The black spot indicates the average position of the formants and the type of the used phoneme. In this case, the sound corresponds to a slightly open “u” with average values ranging between the “o” and the “u” vowels. In the Anglo-American phonetic alphabet the vocoid position corresponds to a sound like “hood.” As it often happens in the Italian language, the length of the final “u” is short and confirms that the explanation given by Michele Dinicastro is correct.
Since in the “e” vowel which comes before, the formantic tracks are broken and there are no laryngeal vibrations, the automatic program does not show the formant chart, but if you look at the spectrogram just examined, you will notice some areas with a sound thickening traces at 617 and 2588 Hertz, which correspond to the values for a little closed and aphonous “e” sound.
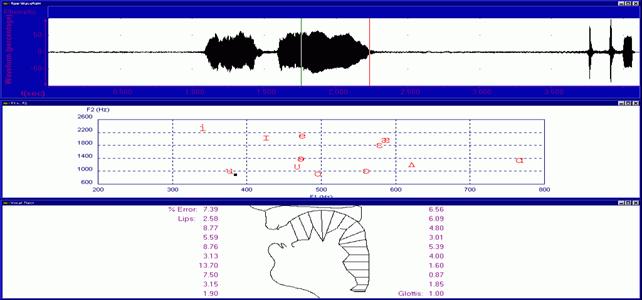
Figure 13 shows a parametric analysis of an EVP recorded by Anabela Cardoso, which evidences the lack of information in the formant structure and in the sound dynamic. Many graphical sections of the analyses show the presence of three formants with a poor bandwidth and a progressively constant temporal trend. Some noise indications are detected with moderate thickening traces of pseudo harmonic components.
The progressive listening made in sequence of these sounds show a verbal elocution which is decoded by the listener as follows: E\RIO\DO\TEMPO.
The analysis of the vowel frequency range is quite difficult and the lack of laryngeal vibrations does not allow a reconstruction of the vocal tract and its phonetic representation on the formant chart. It practically can be considered as sounds structured in a segmental way which, if heard with a certain uttering speed, take on informational and linguistic meanings for the listener, something like a kind of a “quantic noise manipulation,” which is typical of the communication channel.
Even if there is a signal which is characterized by a great saving of energy, the decoding would seem correct because the compacting bands roughly correspond to those of the relevant vocalic sounds. If we had more spectral information, we could have identified further anomalous elements in the acoustic indexes between the place of articulation and the way of articulation, thanks to a more detailed analysis. Their classification is as follows:
Indexes of place, classified in three categories:
- Locus of transition of F2
- Locus of transition of F3
- Frequency of noise
Indexes of way, classified in six categories:
- Form and speed of the transitions
- Locus of transition of F1
- Noise presence
- Noise length
- Continuity or discontinuity of the connections, intensities and relative lengths to differentiate hard and voiced consonants
Figure 13: EVP received by Anabela Cardoso saying E\RIO\DO\TEMPO.
4. Summary of the resulting anomalies in the preliminary stage of the study
- Lack of the fundamental frequency or its partial presence with multiple fragmentations.
- Lack of the vibration of the vocal chords in timbre sounds with or without the fundamental frequency.
- Formantic structure sometimes replaced by a noise thickening in the relevant bands and showing a severe modification or a non-sinusoidal trend.
- Anomalous increase in the signal strength of the second formant and strengthening of the upper harmonics, poor melodic texture and fragmentation of the spectrum.
- Anomalies in the frequencies, with too high values of the fundamental and formants frequencies.
- Anomalies in the time of energy distribution in the whole signal structure which would seem to be made of many small side by side energy-packages, where it is difficult to separate the different structural elements of the spectrum.
- Anomalies in the signal periodicity detected in the autocorrelation analysis.
- Anomalous changes in the spectrum density.
- Anomalies in the utterance; it is difficult to obtain an acoustic chart.
- Anomalies in the time flowing with inexplicable slowing down or speeding up of the speech.
- Partial or total elision of the consonants.
- Harmonic distortions.
5. Comparative analyses for speaker recognition.
The method for identifying a speaker or for comparing an unknown voice (usually coming from telephone or from environmental interception) with a well-known speaker (also recorded) started in 1937, during the proceedings against the presumed kidnapper of Lindberg’s son, the first man to fly across the Atlantic.
At that time, it was only made by an acoustic trial. Later on, with the help of the so-called phonic proof and further improvements, the method developed by L. Kersta in 1962 was used. Kersta’s method consists of analyzing a graphic track, called spectrogram, with instruments like the Sonagraph, made by Kay Elemetrics, or using similar methods of analyses carried out through a computer with a data acquisition card, as in the examples below.
The chances of identifying the speaker are based on the hypothesis that any subject pronouncing a phoneme adapts the oral cavity in an “univocal” way, depending only on the person’s physical characteristics (dimensions of the larynx, of the oral cavity, of the tongue etc.). These anthropometrical characteristics shape the starting spectrum obtained by the vocal chords, intensifying for each vowel, some frequencies and attenuating others, so that they are recognizable.
The graphic of the spectrogram permits the display of these frequencies, showing the increases in sound intensities and attenuations called “formants,” which is shown by the intensification and/or attenuation of some lines in the spectrum. These are typical in a certain numerical range called “range of existence,” of each vowel and also typical, but not as certain as above, of each speaker. Remarks similar to those made on vowels can also be made about voiced consonants, such as \M\, \N\, \R\ since they show a formantic trend. The “melody” of the speech can give us a further parameter of analysis.
Such characteristic can be found in every “non-robotic” speech and can be seen in the spectrogram as a slant in the track corresponding to the fundamental frequency (also called “pitch” or F0). In addition, the same characteristic can be found in the graphic of the F0 trend which can be drawn through the Cepstrum even if the “natural” melody is always altered in a counterfeit voice (musicality of the language). However, an average difference in highness (frequency or pitch), derived from a good number of elements, can be independent of counterfeits and intentional changes.
Taking into account all these remarks and the qualitative and noise problems due to communication channels, the problems listed above increase considerably when the presumed paranormal voices, which have a peculiar personality, are compared with the voices that the presumed dead people had in their lifetime. The expert very often does not have enough samples to make a sufficiently probative analysis.
The presumed paranormal voices have a spectrum of poor quality with a large amount of noise, maybe due to their own characteristics or to the noises of the communication channel. In messages received in different times and through different experimenters and instruments, the same presumed personalities produce fairly different spectrums, characterized by an unusual fluctuation in the range of frequencies and, above all, in the time domain. These fluctuations can mislead us into either a false identification or a false denial because of the vector segregation systems which works with a multiple fragmentation of the signal. In these cases, besides the statistical and mathematical methods, it is necessary to work manually. That is to say, to analyze their spectrographic tracks.
Since it is impossible to take a phonic sample with the same informational content as is done in the legal investigations, the research shows a high standard of errors. In some lucky cases, when we have the same words to compare, the research is more reliable and probative but it is a very rare event.
I must stress that the comparison must take into account the number of available linguistic events, besides the quality of the acoustic evidences and the noises of the communication channel (radio, telephone, recorder, computer, etc.). In other words, if the same informational contents are available, it is sufficient to have two words which last for two/three seconds to make a comparison. After the differential comparison with a matrix of at least 154 speakers (error of 4.4%) or 928 speakers (error of 2.8%), the result will be highly probative.
It goes without saying that with a speech which lasts at least 10 second and even if it does not have the same informational content, the comparison will be nonetheless acceptable, because some vocoids and contoids (vowels and consonants) for the analysis (10 or more vowels and consonants) are available and useful to draw up an histographic average of the speaker. Here below I will show you some examples of comparison between EVP voices and human voices in order to identify them (Figure 14, 15 and 16).
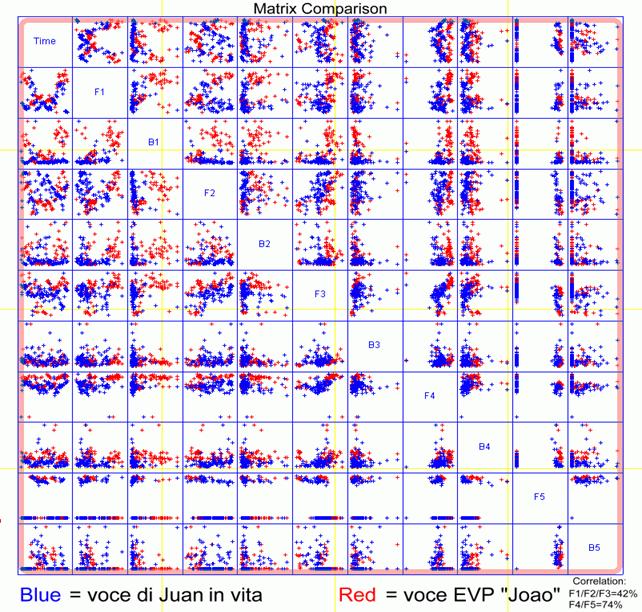
Figure 14 shows the matrix formant layout of the EVP received by Anabela Cardoso. In red, are represented the formant distribution values relevant to the paranormal voice of a dead person named Joao. In blue, are represented the formant distribution values relevant to the voice of the same person when he was still alive. This is the person who is supposed to have spoken the EVP message.
Unfortunately, due to the scarcity of the available evidences—that is to say only one word—it is impossible to identify the voice with the help of objective parametrical methods which give us a certain reliability.
The conclusions that we can advance is that such a voice can be considered compatible, that is to say not dissimilar, since the two vocal samples have the tracks of the formants F4 and F5, which mainly characterize the individual features of the speaker, similar for 74%.
A different example concerns a case of identification made on an average of 3 seconds of speech with regard to an EVP recorded in Grosseto, Italy, at Marcello Bacci’s centre.
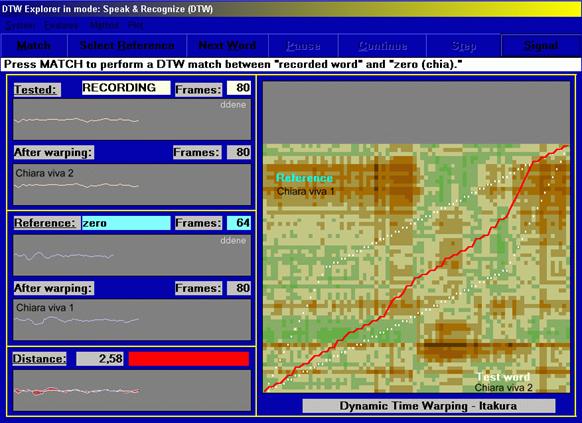
The Euclidean distance of the two vocal marks is 2.58.
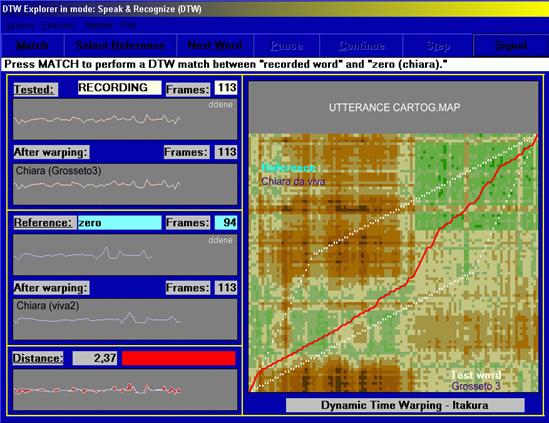
Figure 15 compares the voice in life of a young girl, Chiara Lenzi, where the verbal elocution was recorded in two different occasions while she is giving out the following words: UN\BACIONE\A\TE\CHIARA. The Euclidean matrix distance is 2.58 for the same speaker. If we measure this distance on an EVP recorded in Grosseto, where the father, Dr. Giuseppe Lenzi, perceptibly recognised his daughter in the following elocution: UN\BACINO\A\TE\CHIARA, we notice a difference in the spectral values with a matrix distance smaller than that previously measured, as shows Figure 16. In this case, unlike the previous one, we can state that the comparative outcomes between the voices considerably prove the identification.
If it had been a comparison between two voices in a threatening phone call or in a legal case of speaker identification, the expert’s opinion addressed to the judge would have been: HIGHLY COMPATIBLE VOICES.
6. Conclusions
In some cases, as above, the anomalies are clear and lean toward a high paranormal index of probability. In other cases the ambiguity of the data does not allow a clear interpretation and differentiation of the event. In such cases, a predisposition towards one of the two different explanations, for instance, towards the normality or the anomaly, shall be chosen as a trend. It is therefore necessary to be very careful to interpret the analyzed instrumental data, because there are many variables at stake, as in the case of the “voice” of Gracula Religiosa.
In my opinion, the organizational capacity of these acoustic signals is of great Importance. The signal can change from a simple noise thickening with poor harmonic content and a low informational standard due to a difficult decoding, to a well-constructed and complex harmonic structure very close to the expression of human language, and with the possibility of decoding them with a high standard of informational capacity.
We think that the study of the psi interaction phenomena in Transcommunication, started at our Laboratory in Bologna (www.laboratorio.too.it) in a common research project with French and Brazil, will lay the foundations for improving the knowledge of these unusual phenomena. This works is unfortunately still ignored today by mainstream science and by many academic parapsychologists.
Bibliography
- Oskar Schindler (1974), Manuale di audiofono-logopedia, Omega, Torino.
- Ferrero-A.Genre-L.J.Boe-M.Contini (1979), Nozioni di fonetica acustica, Omega, Torino.
- Muljacic (1969), Fonologia generale e fonologia della lingua italiana, Il Mulino, Bologna.
- De Dominicis (1999), Fonologia comparata delle principali lingue europee moderne, Coop. Libr. Universitaria Edit. Bologna.
- Gramming-J.Sundberg (1988), Spectrum factors relevant to phonetogram measurement, JASA 83, pagg. 2352-2360.
- Alton Everest (1997), Manuale di acustica, Hoepli, Milano.
- L.Klevans-R.D.Rodman (1997), Voice recognition, Artec House Inc.,Boston.
- B.Randall (1987), Frequency Analysis, Bruel Kjaer
- Gullà (2000), Voci paranormali e analisi di laboratorio, L’uomo e il Mistero/8, Edizioni Mediterranee, Roma.
- Gullà (2000), Proposta di una metodologia di ricerca per l’analisi di presunti eventi acustici paranormali di origine fonetica, Atti del Convegno del Ce.S.A.P. (Dip. di Bioetica) Università degli Studi di Bari 27/10/2000.
- Presi (1988), Psicofonia e paranormalità elettroniche, in “Esperienze Paranormali”, AA.VV., Edizioni Mediterranee, Roma.
- Presi (2000), Il paranormale in laboratorio: “voci psicofoniche”,”voci telefoniche” e ”voci dirette” a confronto, L’uomo e il Mistero/8, Edizioni Mediterranee, Roma.
- Gullà. (2003), Riconoscimento ed identificazione tramite le impronte vocali, Relazione contenuta nel 2° Anno del Corso Multimediale di Biopsicocibernetica del Laboratorio di Bologna.
![]()
1 thought on “Computer–Based Analysis of Supposed Paranormal Voice”